Case Study: Supporting a major automaker in an electric truck grant application with air pollution data analysis
Challenge
A major automaker needed comprehensive route analysis data to support an electric truck grant proposal, requiring precise measurement of diesel truck miles driven through California's Disadvantaged Air Quality Communities (DACs) across multiple air districts.
Solution
- Processed and cleaned delivery route data from 845 store locations, filtering to 408 active delivery destinations with standardized location codes
- Mapped 36,563 individual truck trips across California's air districts using geospatial analysis and route optimization algorithms
- Overlaid delivery routes with official DAC boundaries defined by California's Environmental Protection Agency Office of Environmental Health Hazard Assessment
- Calculated precise mileage distributions across 10 air districts, identifying concentration patterns from San Francisco Bay distribution centers
- Developed interactive Kepler.gl visualizations showing route overlays, heat maps, and miles-per-air-district breakdowns
- Created comprehensive data rankings identifying highest-impact DAC areas for electric truck deployment prioritization
Results
- Quantified 7.47 million total miles driven across California air districts with detailed geographic distribution analysis
- Identified San Francisco Bay (38.4%) and San Joaquin Valley (27.7%) as primary delivery corridors representing 66% of total mileage
- Mapped over 2.4 million miles driven specifically through disadvantaged communities, with San Joaquin Valley showing highest DAC impact
- Delivered interactive visualization tools enabling dynamic exploration of route patterns and environmental impact zones
- Provided compelling data-driven evidence supporting Volvo's grant proposal for targeted electric truck deployment strategies
- Created reusable analytical framework for future route optimization and environmental impact assessment projects
The comprehensive route analysis provided the automaker with data-driven evidence for their grant proposal, demonstrating how to measurably reduce air pollution in disadvantaged communities.
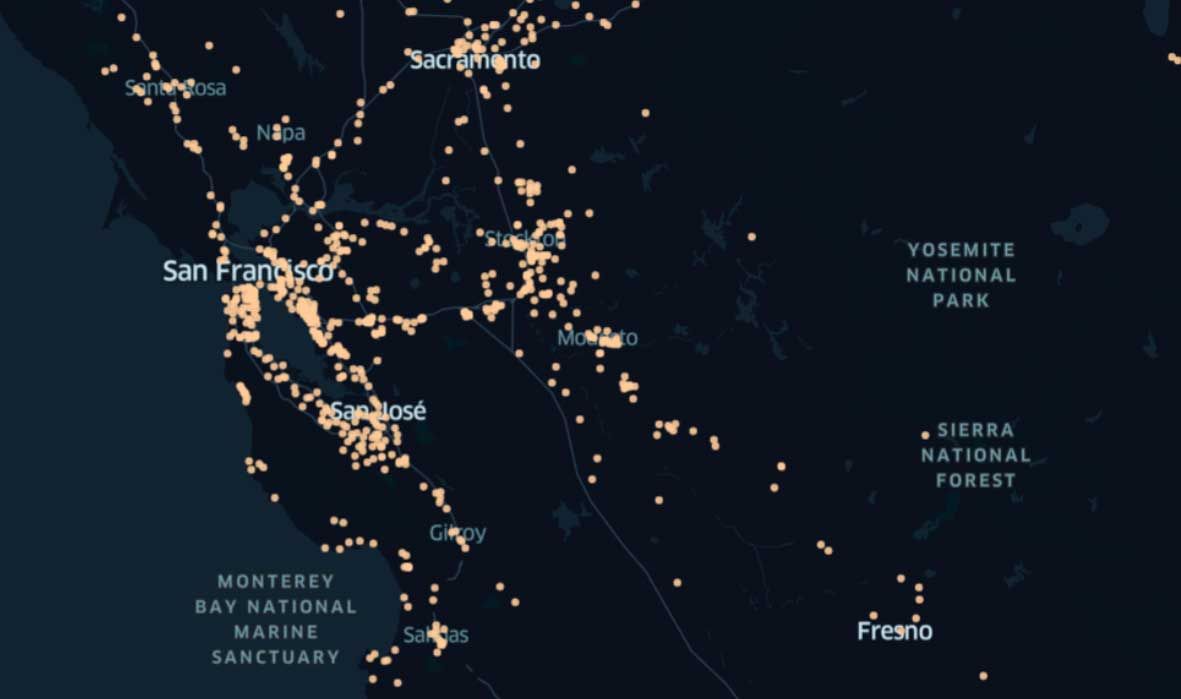
845 store locations
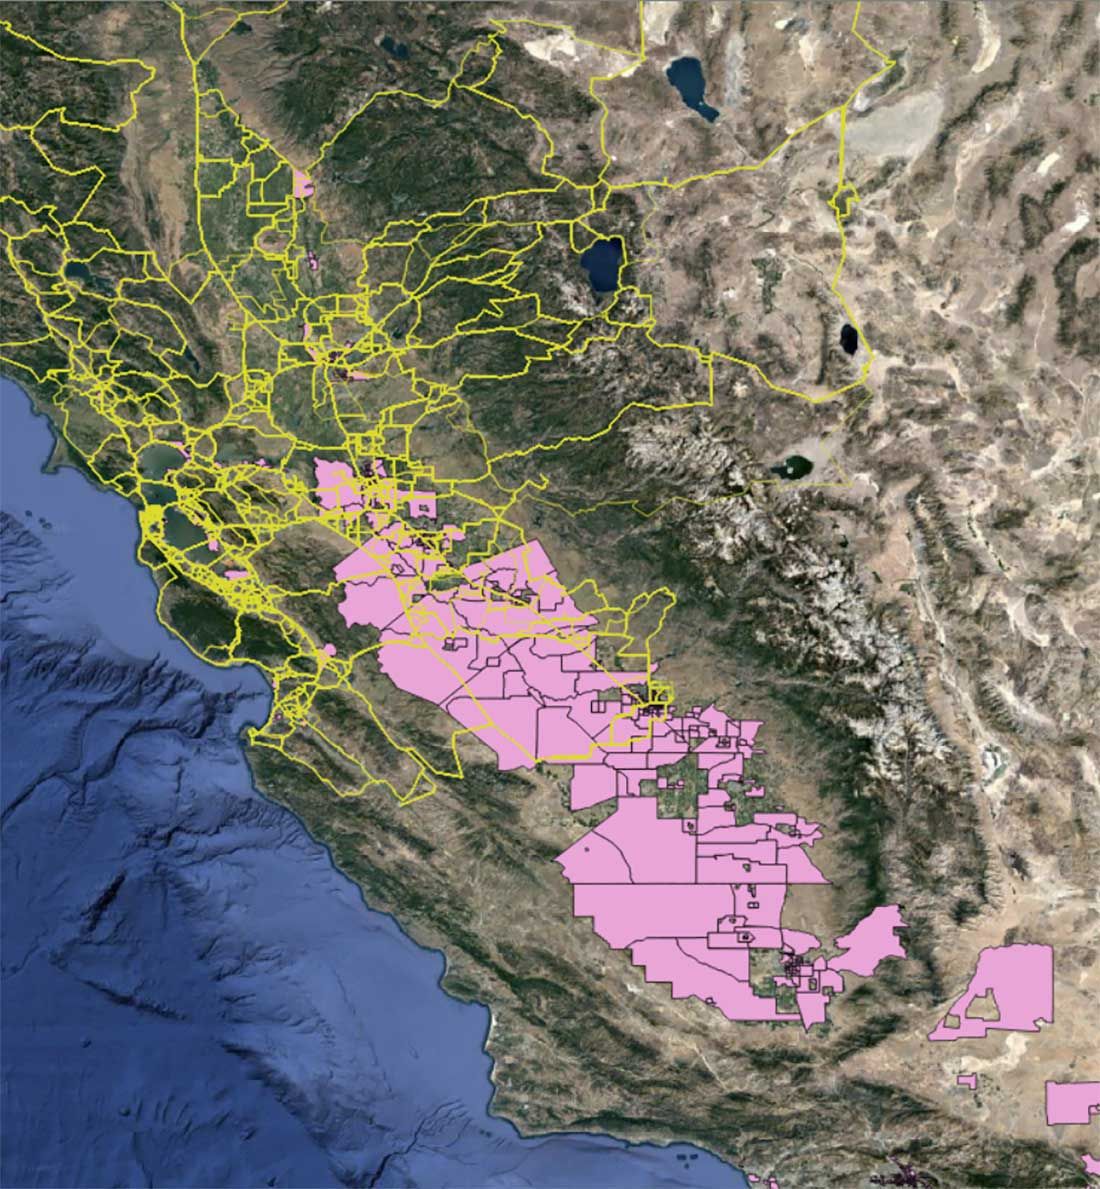
36,563 total trips (trip routes in yellow / DACs in pink)
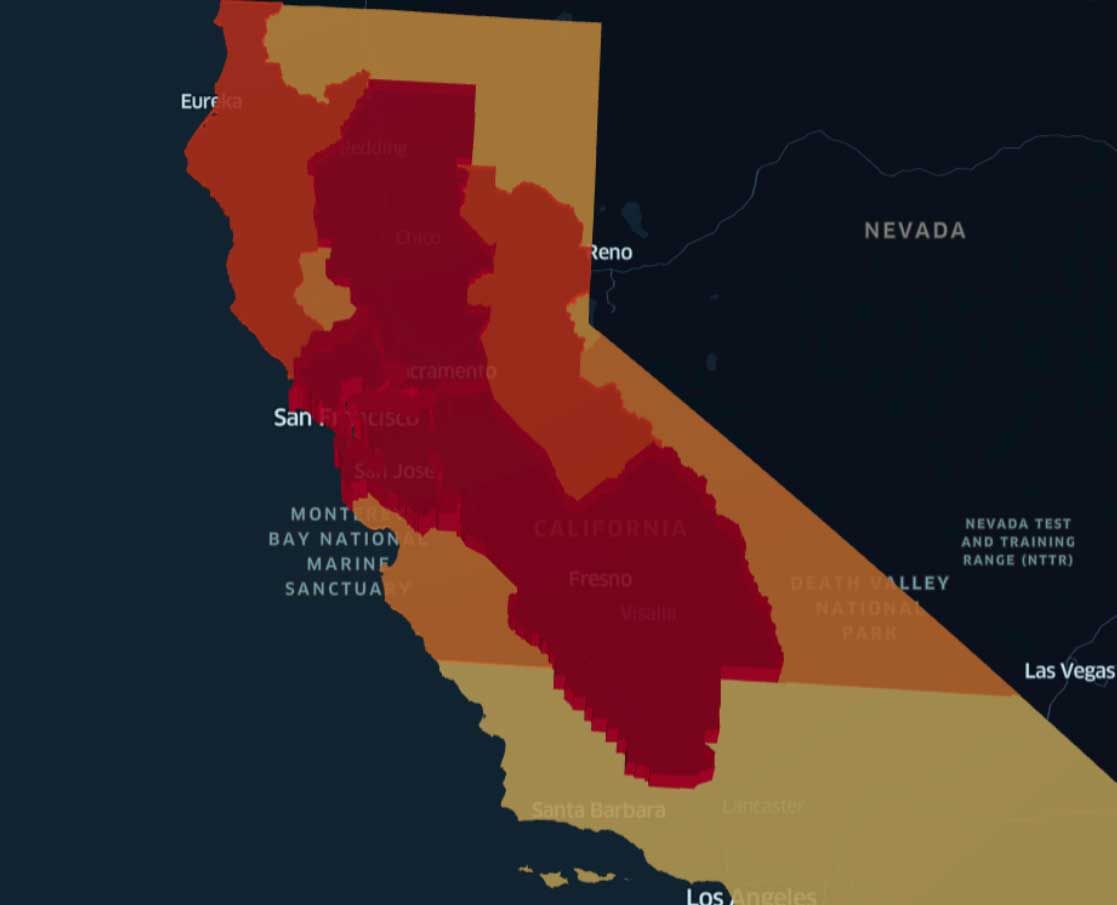
Number of miles shown as a heatmap from yellow (low) to red (high)
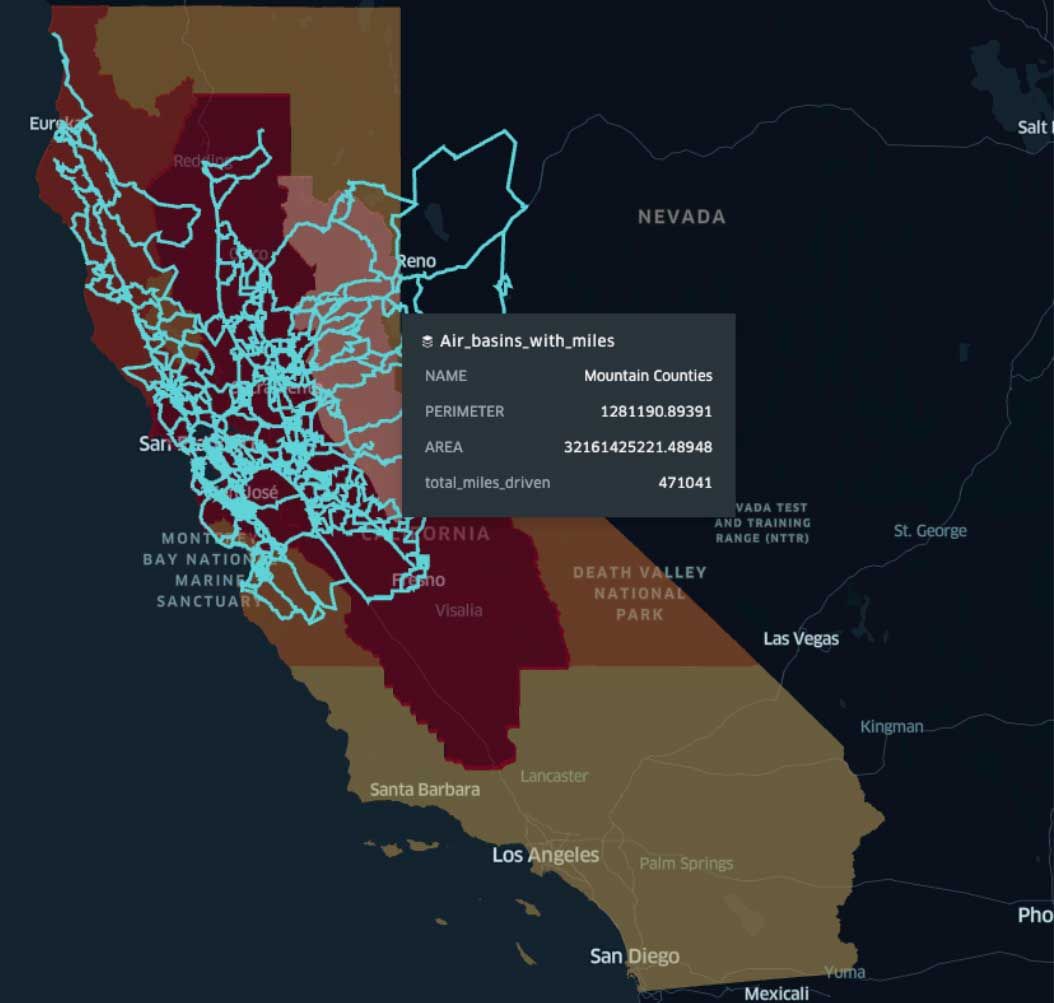
Air district miles (routes overlaid on air districts)
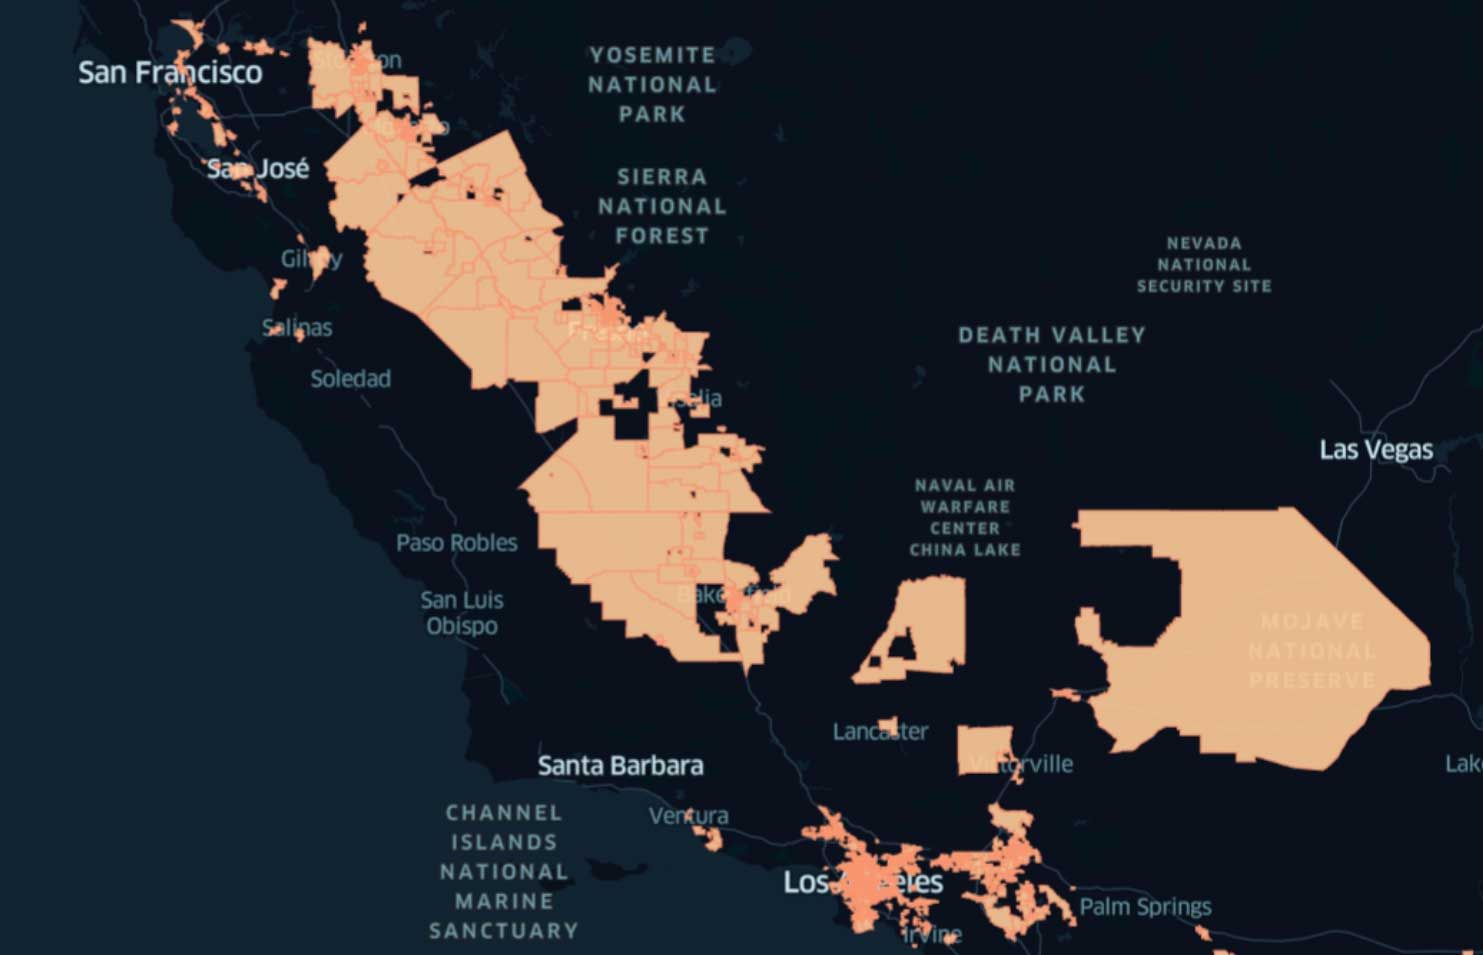
2005 Individual DACs (Disadvantaged communities as defined by the CA EPA's Office of Environmental Health Hazard Assessment)
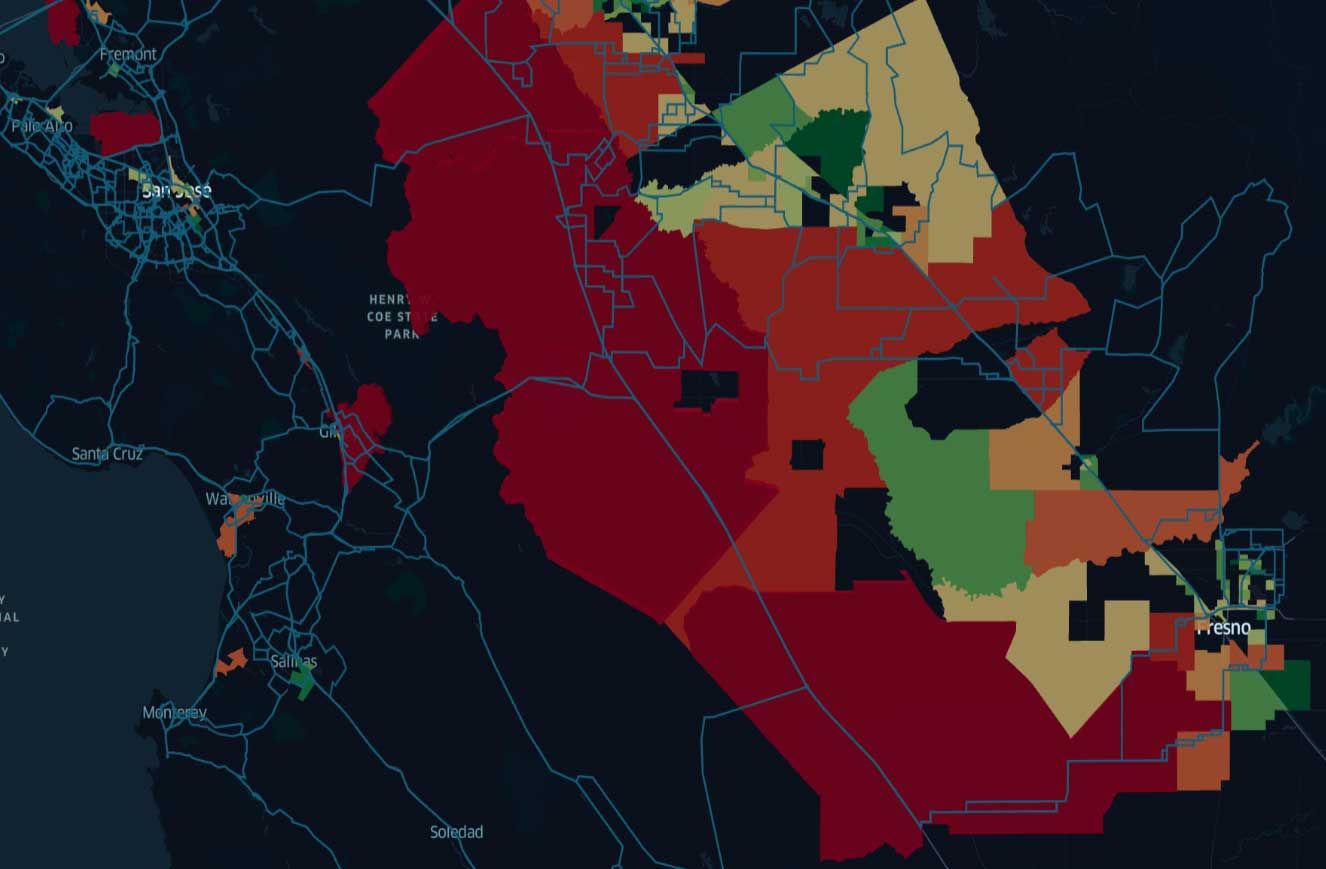
Relative miles driven shown as a heatmap from yellow (low) to red (high)
